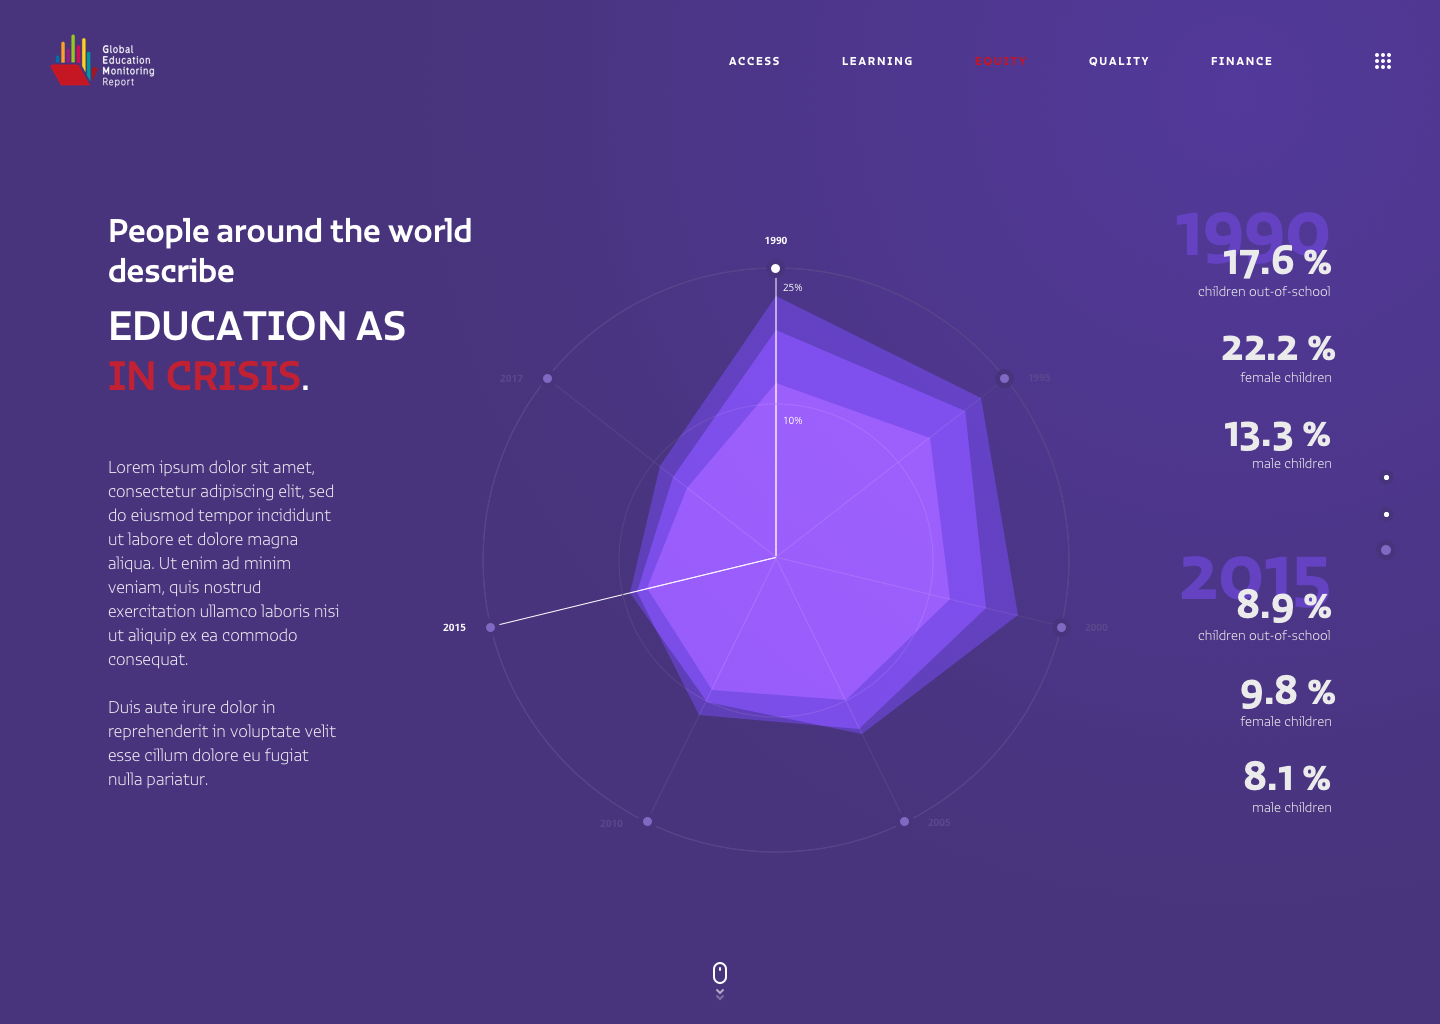
Data visualization project
Every once in a while we get reminded why we love working what we do. Every once in a while we get a chance to work with really talented and dedicated people who want to change and improve the world we live in. That’s when you feel really empowered to actually do some impact world wide. We all get very motivated in such work environment and really give our best. In these situations working hard and giving 110% of you doesn’t seem like any issue or a problem.

Exactly this happened in our office while we were preparing a pitch for one of the greatest human movements in the world. They have prepared really professional and detailed functional brief and specification that was really pleasure reading. Understanding their needs was something that required digging a bit deeper and reading between the lines.
We all knew roughly what are the statistics behind availability and attendance of schools around the world. But no one knew exactly how devastating those numbers are. That’s why we felt utterly motivated to understand the data, dig a bit deeper, find best way of visualizing this data and presenting in best possible way. After all this time, we were able to deeply understand what these raw numbers tell and how to present them in best possible way.