United Nations is not a client that needs an introduction. Their UNESCO program doesn’t need it as well. We had an immense honor to be working with such a great and human partners as helping those in need is in core of our beliefs.
01
Customer
Problem
UNESCO has a widely spread Global Education Monitoring Report (GEM Report) which is created every year in order to display different education parameters around the world. We had a challenging task of creating visually appealing, yet flexible and useful tool that’s going to enable people from all around the world insight in how educations changes in different parts of the world over the years.
Solution
After first digesting vast amounts of data, we set to visually present these information in best possible and user friendly way. Big challenge was responsive design which still had to present the data and diagrams in visually appealing way.
0
Interactive charts
0
Design days
0
Implementation days
02
Design process
Deep knowledge of statistics and data manipulation was need in order to fully understand overall challenge, even in the design phase. We needed to create accurate, yet visually appealing data in interesting way. The biggest challenge was finding interesting facts and highlighting them.
- Discovery with the client
- Competitors & User Research
- User Flows & User Story Mapping
- Interactive Wireframing
- Testing on users & feedback implementation
03
User Flow
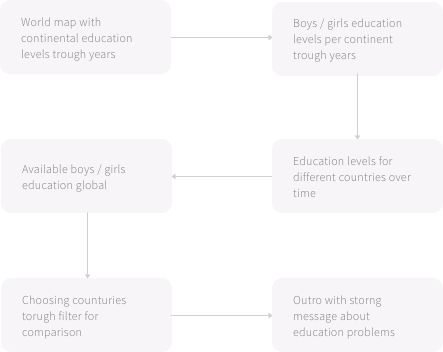
Once user opens home page of UNESCO tool, we present an overall world map with different education levels for different continents. After inspecting this data, user is able to click on any of the data groups (continents in this case) and inspect difference in education levels for boys and girls. In the next step, user is able to compare education levels for different countries over time. It’s really interesting to see some less developed countries in their effort to provide their kids with proper education. Next steps displays difference between available education to boys and girls in different countries.
04
Wireframes
Before getting to the design stage, we always create interactive prototypes. They allow both the team and the customers to understand how the product will work.
Interactive prototypes are also a perfect way to run user testing without expensive full-fledged development.

Design System
We follow the principle of atomic design when building design systems. Specifically, because this approach performs well on the front-end as well.
Documentation
Basics
Naming rules
Writing principles
Animations
Layouts
...
Base
Grid
Spacings
Colors
Typography
...
Atoms
Buttons
Controls
Icons
Links
Illustrations
...
Molecules
Fields
Dropdowns
Lists
Tables
Tabs
...
Organisms
Headers
Forms
Modals
Charts
...
Basing user interface on existing brand guidelines
Vita Std font family

Primary colors
Minsk
#48347d
C42
M58
Y0
K 51
R 72
G 52
B 125
Thunderbird
#c41623
C0
M89
Y82
K 23
R 196
G 22
B 35
Secondary colors
Allports
#006da4
C100
M34
Y0
K 36
R 0
G 109
B 164
Sea Buckthorn
#f49c24
C0
M36
Y85
K 4
R 244
G 156
B 36
Violet Eggplant
#941b80
C0
M82
Y14
K 42
R 148
G 27
B 128
Citron
#94c01e
C23
M0
Y84
K 25
R 148
G 192
B 30
Razzmatazz
#d50c51
C0
M94
Y62
K 16
R 213
G 12
B 81
Lightning Yellow
#fdcc1c
C0
M19
Y89
K 1
R 253
G 204
B 28
Persian Green
#009992
C100
M0
Y5
K 40
R 0
G 153
B 146
Keeping up with Tech Trends

D3.js
D3 was obvious choice for this project. It allows binding arbitrary data to DOM and applying different data-driven transformations to the document.

SCSS
Sass is our go to CSS extension language. We use it in every single project we do and find it irreplaceable.

HTML
Again, not a single project can go without HTML5.
Interactive charts
We follow the principle of atomic design when building design systems. Specifically, because this approach performs well on the front-end as well.
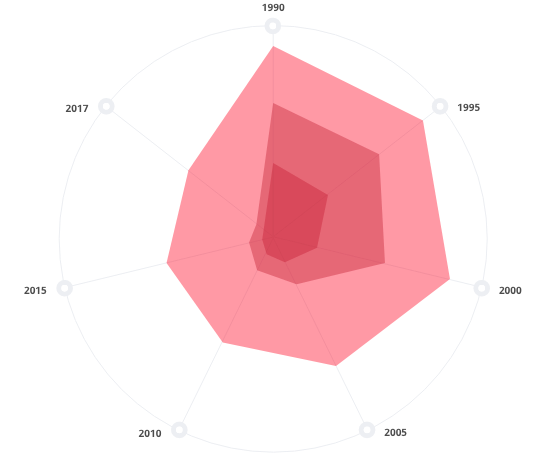
Spider chart
Also called Radar Chart, Spider Chart is a graphical method of displaying multivariate data in the form of a two-dimensional chart of three or more quantitative variables represented on axes starting from the same point. In our UNESCO project, this chart is used to display how access to education to boys and girls changed over the years worldwide.
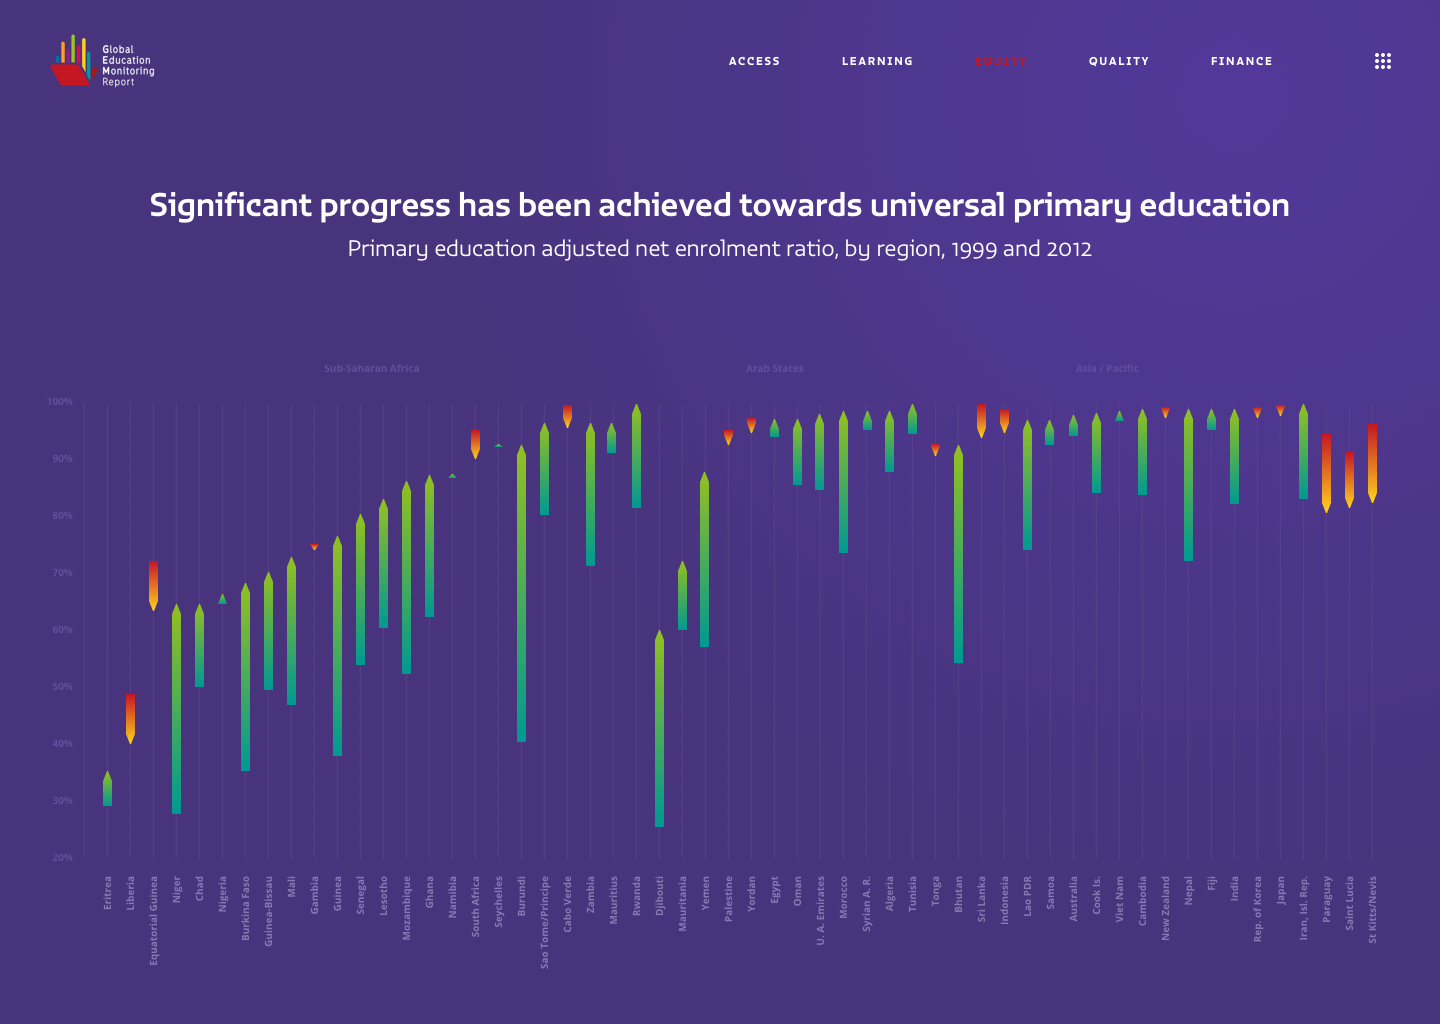
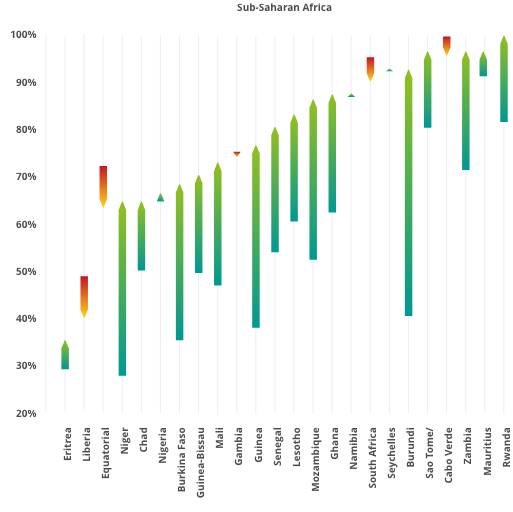
Histogram chart
A Histogram Chart is used for continuous data, where the bins represent ranges of data, while a bar chart is a plot of categorical variables. In our UNESCO project, we display difference between availability of education for boys and girls in different countries. Obviously, the biggest the gap, the biggest the amount of boys that go to school compared to girls.
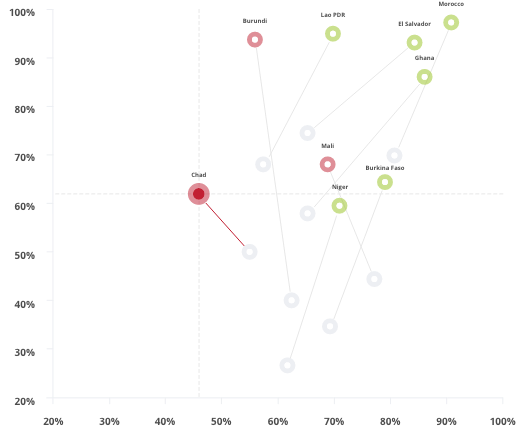
Scattergrams chart
Scattergrams chart (or scatter plot) is a type of plot or mathematical diagram using Cartesian coordinates to display values for typically two variables for a set of data. Here, we use it to display positive and negative change in education for different countries.
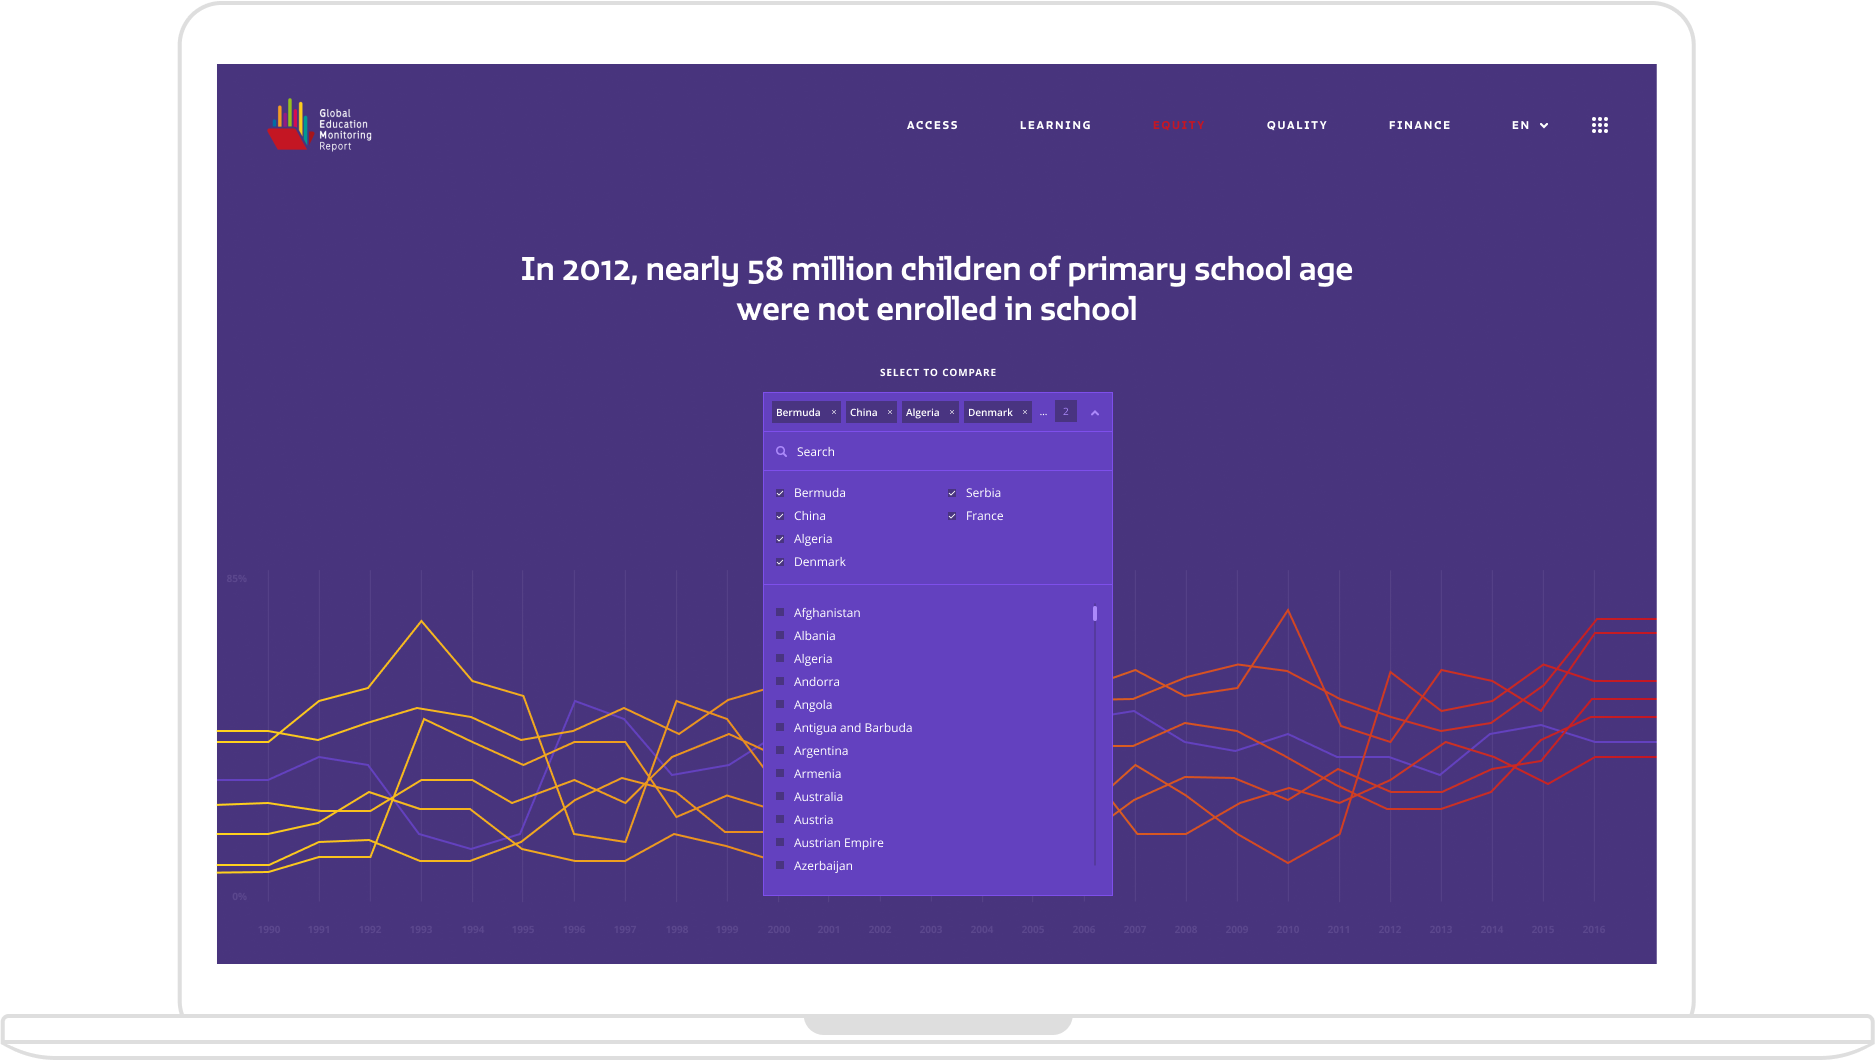
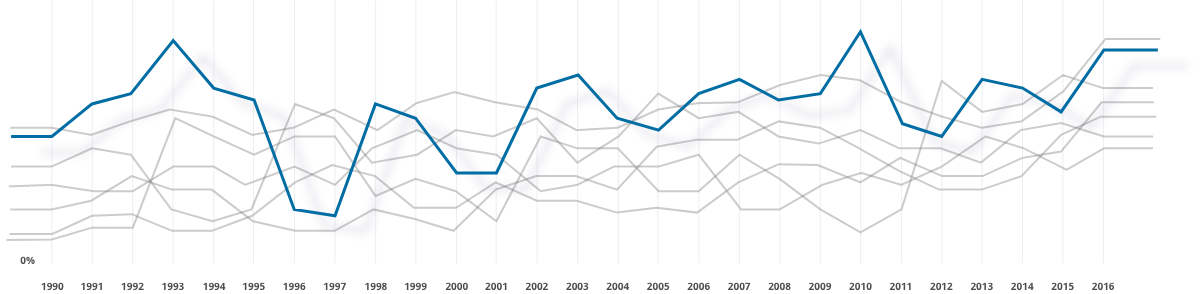
Line chart
Line chart is basic type of chart present in almost every statistic field. It’s a type of chart which displays information as a series of data points called ‘markers’ connected by straight line segments.
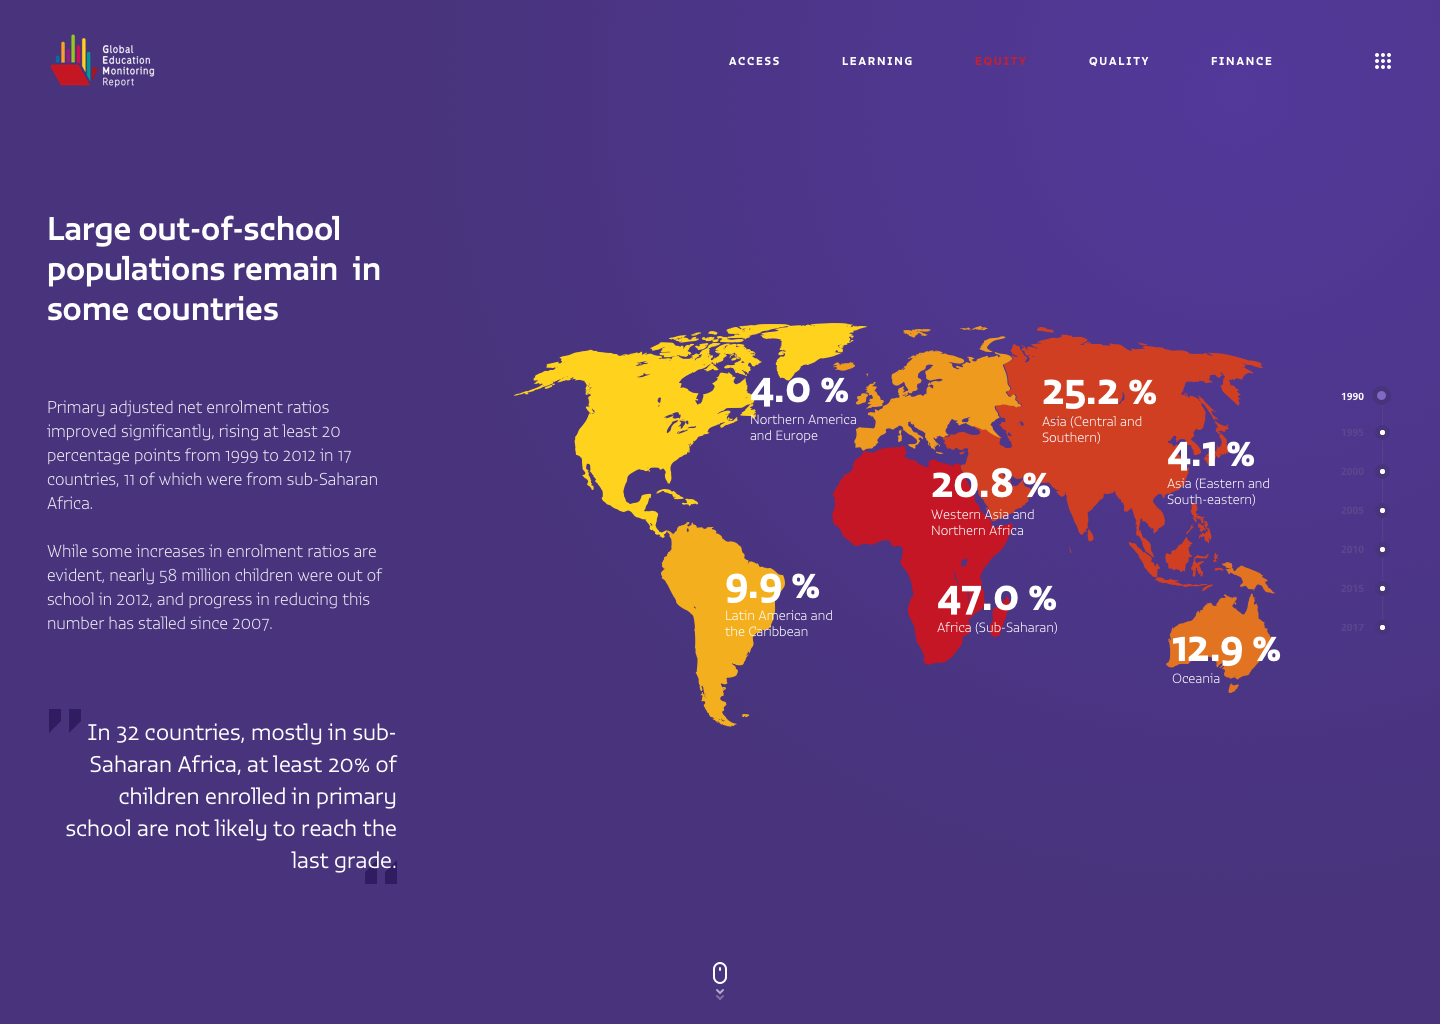
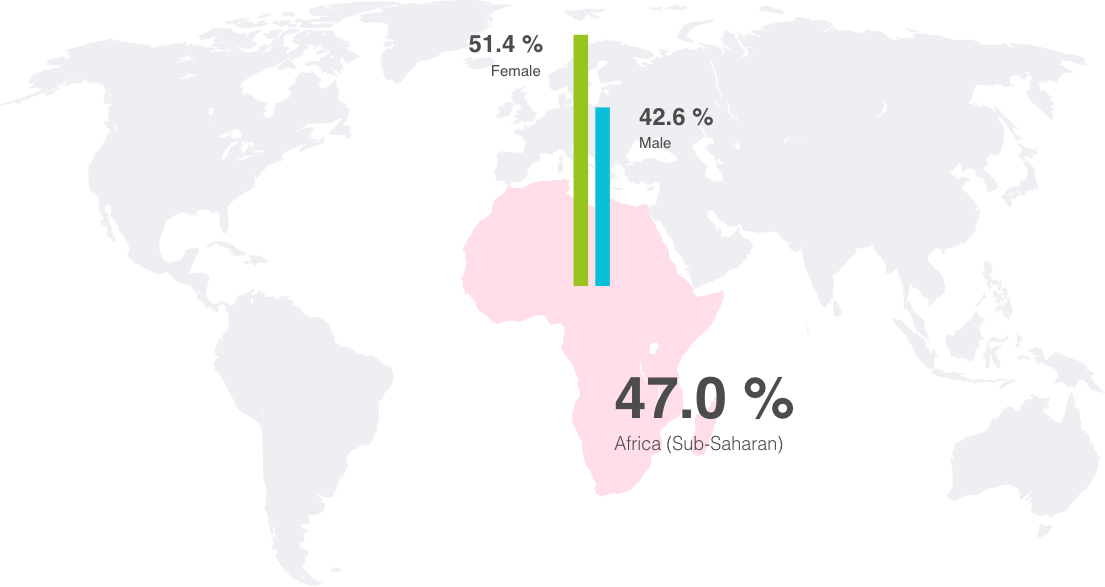
Interactive world map
We used D3 to display interactive world map and overlay the map with comparative values for accessible education for boys and girls. This has proven to be best way of displaying any geographically driven data.
Enjoy our work
Have a sneak peek at some of our other projects and if you like what you see don’t be shy and get in touch! We would love to know more about you and your business.